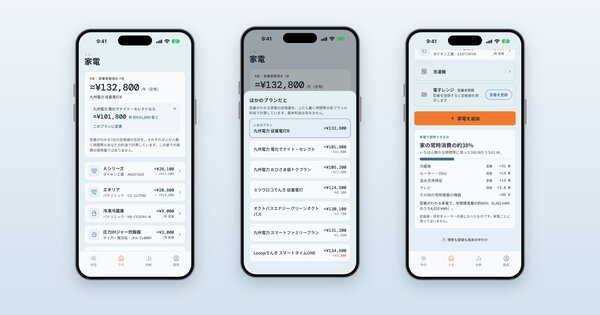
Uchi Energy tells you what's likely drawing power in your home when everything looks switched off: the fridge, the washlet, the router, the water server. To do that, the app needs to know roughly what those things actually draw, and those numbers have to come from somewhere.
This week we replaced our rough estimates with figures we can trace back to a public source. Here's how.
From estimates to the government catalog
Most of our appliance figures now come from the 省エネ性能カタログ, published by Japan's Agency for Natural Resources and Energy (資源エネルギー庁). It lists the annual electricity use of every refrigerator, freezer and washlet sold here, measured under a national test standard.
We took the 2025 edition and computed our ranges from every listed model, about 1,300 of them, rather than from a handful of examples. For each category in the catalog, such as fridges of a given size, we use the middle half of the market: the 25th to 75th percentile of what's actually on sale.
Two independent passes, and checks that run every time
A figure is only as good as the way it was extracted, so we didn't stop at one pass. We built the extraction twice, independently, and compared the results. The second pass also counted eight washlet models that print a small mark next to their efficiency rating, and kept the catalog's own summary rows out of the sample.
That method is now built into the tool, which checks the data three ways on every run:
- Price check. Every model's listed annual cost must match its energy use at the catalog's own rate of ¥27/kWh.
- Summary check. For each category, our minimum, maximum and average must match the ones the catalog prints.
- Completeness check. Every priced row in the catalog must be counted, so a model can't silently drop out.
If any check fails, the data isn't updated. With all three in place, our averages match the catalog's printed figures exactly.
What changed in the app
The always-on card now shows these sourced ranges:
Appliance | Before | Now |
|---|---|---|
Refrigerator | 30–80 W | 29–46 W |
Washlet | 15–40 W | 9.5–26 W |
Router and ONU | 15–40 W | 8–20 W |
TV and recorder on standby | 10–30 W | 0.4–4.8 W |
The new ranges are tighter and closer to what current appliances draw. The top of the fridge range is a model about ten years old, and a modern TV switched off draws just 0.2–0.3 W.
The subscription page now uses the official figure for standby power: 228 kWh a year per household, about ¥7,000 at ¥31/kWh.
Every figure carries a label
Not everything can be measured from a catalog, so every figure in our dataset says where it came from: measured under a test standard, claimed by a manufacturer, or estimated by us. Three are estimates: a router's typical draw, a ten-year-old fridge, and a water server with its eco mode off.
The router shows why the label matters. Routers are covered by Japan's energy-efficiency scheme, and rated in watts. But the category's rules exclude any device with modern Wi-Fi (802.11n or later), which is every home router sold today, and the official product database for it is empty. Manufacturers publish only maximum ratings, several times what a router uses sitting idle. So we label our router figure as an estimate rather than present it as a measurement.
The water server is the next figure we're refining. One manufacturer publishes figures measured under the water-server industry's own test standard: about 31–35 W with eco mode off. That standard assumes light use, 1.2 litres a day in a 23 °C room, so a busy household will draw more. We're weighing it against independent measurements before updating the app.
Tracing sources back to the original
Our whole-home standby figure comes from a national survey from 2012. We confirmed it in the 2019 edition of the same catalog, which reprints the survey's figures and which anyone can download and check. Since the survey is now fourteen years old, and standby use has very likely fallen since, we treat 228 kWh as an upper bound rather than a current measurement.
Why we publish this
These numbers end up in front of you as advice about your own home, and we think you're entitled to know where they came from and how they're checked.
All of this is public data, the same for everyone. Your own electricity use is analysed on your phone and never sent to us.
Sources
- 省エネ性能カタログ 2025年版, 資源エネルギー庁, 2025. catalog2025.pdf
- 省エネ性能カタログ 2019年版, p. 6 (household standby), 資源エネルギー庁, 2019. catalog2019.pdf
- Routing equipment (小型ルーター) category guide, 資源エネルギー庁 省エネ型製品情報サイト. guide_routing.pdf
- 平成24年度 待機時消費電力調査 報告書概要, 資源エネルギー庁, 2012. taikiji_2012.pdf (figures as republished in the 2019 catalog)
- JDSA 消費電力測定基準(1804), 第2版, 一般社団法人 日本宅配水&サーバー協会, 2021. 20211015_2.pdf
- amadana グランデサーバー product page, プレミアムウォーター. premium-water.net
Refrigerator and freezer figures are measured under JIS C 9801-3:2015, and washlet figures under the corresponding national test method. Test conditions differ from real homes: a fridge boxed in on both sides, for instance, uses more than its rating.